shadows-highlights-midtones-whites-blacks

All about Histogram

Let’s begin with understanding What is a histogram? a histogram is a graph showing the distribution of light in an image. histograms may appear to be rather complex at first. Actually, they aren’t. Reading histograms is helpful to improve the quality of the image and also get correct exposure.

A histogram represents the values of images in tones graphically. It shows the tones in the image from dark to bright, that is from zero brightness to full 100% brightness. Dark tones are shown on the left side of the histogram and bright tones on the extreme right side. The middle part shows the midtones which are neither too dark nor too bright. To make it simple, Pure black is on the extreme left, Pure white on the extreme right and anything in between is the tone of grey. Histogram depends on the exposure and the curve and other settings.

Understanding Histogram is important as most of the time, the reading of the Camera Screen is not very accurate. So to get the properly exposed photo while shooting, Histogram which is the graphical representation of the exposure is the best tool.

So once you understand this, you will clearly understand the exposure of the particular image which will help you shoot correctly exposed images every time.

Highlights& Shadow clipping

When the tones of any image touch the edges of a histogram, it results in loss of details of the image called Clipping.

Shadow Clipping

When the histogram touches the left edge, it makes that portion of the image completely black with no details which are known as shadow clipping.

Highlight Clipping

Similarly, when the graph touches the extreme right side it results in a completely white image which is called highlight clipping.

highlight-clipping

Exposure & Histogram:

Under Exposure:

The above image is under-exposed as most of its bright details are lost. The histogram also reveals the shift towards the left. Some details are clipped to the left and the rest are in the shadow range. This image is called an under-exposed image.

under-exposure-shikaras
under-exposure-histogram

 Over Exposure:

This image is overexposed, it’s pretty bright. Many tones are bright with very little dark tonal range. A big part of the image is completely white with a lack of details. The histogram also reveals the sharp shift towards the right.

over-exposed-shikaras

Reading Histogram:

The important thing about the histogram is that if a peak on the right or left is touching the edge of the graph, it clearly shows that there is a particular portion of the image that is completely white or completely black with no details. So this image will not have any data, which means that nothing can be done in post-production and no details can be restored. However, the point to be noted here is, your peak should not be at the extreme right or left.

Day Shots:

If you are shooting during the day, there are chances that your peaks are towards the right but make sure that they never touch the edge. If your histogram shows the peak in the mid-tones area, the whites in the image will probably look greyish.


Night Shots:

The scene during the night shots is a low-key image. Here, the histogram would be more prominent on the left side. Also, there is a possibility of the peak on the left edge indicating a solid black color in the shot.

High contrast Shots:

Shots that are taken time when there is a lot of contrasts in terms of extremely dark and bright tones and few or no mid-tones are called High-contrast Shots. In this case, the histogram also would show more peaks on left and right and very few in the middle.

Low Contrast shots:

Scenes, where there are a lot of mid-tones and a very few high tones, such scenes will have a histogram in a hill shape.

PINK-TULLIPS-MANUAL-PHOTOGRAPHY
Day shot
red-jackes-bicycle-rider
Night Shot
people-on-the-roadside-low-light-photography
High contrast shot
flying-blue-and-green-humming-birf
Low contrast Shot

Photography is a Scientific Art, so this was the science part of it. But to cater to the art part, you, as a photographer, are the best person to decide to either accept or reject the information shown on the histogram. Wherever you feel unsatisfied with the data, you can easily go and make the necessary changes in the exposure triangle. Remember, the histogram is a representation of tones you capture.

Easy Tips to get better images with Histogram:

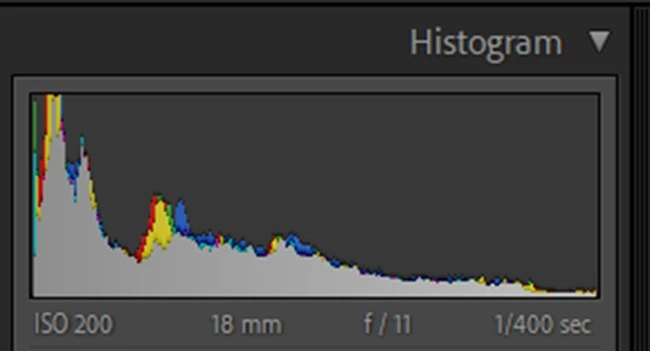
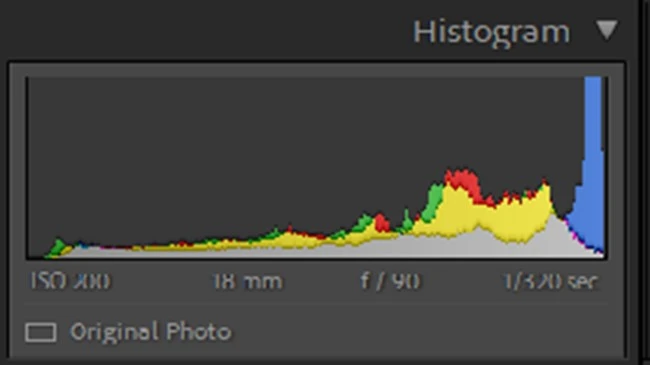
Easy Tip 1:  To get a better tonal range, the technique used by most photographers is to expose your image towards the right. So, you would check the histogram before capturing the image and push it a little towards the right where there are more highlights and during post-production, get all the details back by using any software like Light room, etc.

Easy Tip 2: Live Histogram:

If you use the live view mode which is available in all mirror-less cameras and some DSLR, You can see the histogram live whilst shooting. This shows the histogram adjusting in real-time as you move your camera.

Conclusion:

It is a good habit to check the histogram while shooting and check for any loss of details, although it is not mandatory.

However, checking the histogram may give you a better image and also a second chance to capture an image while you are still at the scene. This is sometimes a lifesaver. A histogram is also available in post-processing to make required adjustments.

I hope this little post on the histogram has added some value and will be helpful to enhance your skill further.

Leave a Comment

Your email address will not be published. Required fields are marked *